
What can Nest’s data tell us about the effects of the Covid-19 pandemic?
Matthew Blakstad, Nest Insight
Since the initial shock of the Covid-19 pandemic, Nest Insight has been exploring the question: what does this crisis mean for people saving in Nest, who tend to be on low to moderate incomes? Our research work was already focussed on the needs and challenges facing this large population of UK workers, and this focus had broadened to explore pensions saving in the context of people’s wider financial wellbeing. Such a severe disruption to the economy, and to the labour market, was bound to have a profound impact on our work.
So how could a research unit based at a large national pension scheme contribute to a better understanding of the challenges facing low to moderate income savers during the pandemic?
To address this question, we’re working with John Gathergood and Jesal D. Sheth of the University of Nottingham, and with Neil Stewart and Chris Firth of Warwick Business School. This collaboration was made possible by a grant from the Economic and Social Research Council (ESRC) as part of UK Research and Innovation’s (UKRI) rapid response to Covid-19 (grant number ES/V004867/1), and also by the ongoing support of BlackRock, JP Morgan Chase, and the Money and Pensions Service, which created a post-doctoral position as part of our wider programme of research into emergency savings and debt.
There are a number of reasons why the Nest data set is proving a valuable source of insight on the impacts of the Covid-19 crisis:
- It’s large, with data covering the jobs and pension savings of over 9.9 million workers, employed at around 870,000 UK employers (as at May 2021).
- These workers tend to be on low to moderate incomes.
- The data arrive in near-real time, because employers using Nest need to return data on all their contributing employees within a few weeks of every pay period.
- The data allow us to analyse labour market factors like job tenure and level of earnings.
Although there are constraints in using administrative data to conduct academic research, the Nest membership data base provides anonymised data which can be used to examine a variety of research questions, with broad societal relevance. And, as with all Nest Insight’s collaborative research, we will be sharing the findings of this research as they emerge. This short series of blog posts represents the first wave of reporting on our findings.
The blog series
By analysing three different data sets running up to February 2021, this series draws out three overarching conclusions about the experiences of this group of savers during the pandemic period:
- Overall workers’ incomes have not fallen significantly, but this situation varies by sector. In the first post, Jesal D. Sheth uses Nest administrative data on pensionable earnings to make comparisons between the rises and falls in earnings experienced by different groups of workers. She finds an overall flattening in pay growth, but also significant falls in earnings for certain types of workers during the first two periods of national lockdown.
- The pension saving behaviours of automatically enrolled workers have not changed significantly to date. In the second post, Chris Firth does a deep dive into administrative data on opt-outs, cessations and withdrawals to see whether members have used any of the available ways to increase their available cash by making changes to their pensions. He finds that, on all these measures, people’s behaviour has remained largely unchanged during the Covid-19 crisis.
- A crisis can prime people to the importance of saving. In the final post, Marwan Hassan and Jesal D. Sheth examine the results of two of our ongoing series of financial wellbeing surveys to see whether the pandemic has changed Nest members’ attitudes to saving. Although they find that certain groups have had more negative experiences than others, they conclude that the full impact of the pandemic on people’s financial lives may not yet have crystallised.
Understanding the Nest population
In presenting this series of findings, it’s worth pointing out some specific characteristics of the Nest membership.
Many workers saving in Nest have earnings that fluctuate from pay period to pay period. Even before the pandemic, over 60% of members had earnings that varied significantly from pay period to pay period.1
Also, many spend relatively short periods in each individual employment. As well as reinforcing the fact that the Nest population includes a high proportion of workers in transient, and sometimes precarious, forms of employment, these factors also made it difficult to pinpoint the impact of the pandemic on the pay of any given individual.
We tried, for instance, to identify which workers had experienced a 20% drop in pay at some point in the period. This could potentially reflect the effect of being moved to the government’s furlough programme, which ensured 80% of pre-pandemic income. But this proved difficult to do, given the number of workers who hadn’t previously had a stable level of income for a sustained period.
We have, however, been able to look at how people’s earnings have fluctuated month-on-month in relation to their pre-pandemic earnings, and this has delivered some valuable findings, which are summarised in the first of our posts.
Looking forward
This initial analysis is valuable, but it also suggests avenues for further research, which is already under way:
- The impacts of the pandemic are far from over, and its effects on workers will last beyond the point where the UK economy reopens. We will continue to update these results to understand the ongoing effects of the pandemic.
- The overwhelming majority of Nest savers are continuing to save at default levels. This demonstrates the resilience of auto enrolment as a way of encouraging saving, but it also raises questions about whether some members are experiencing pressures on their household finances, as they continue to save for retirement. Future work will explore the interactions between pension saving and debt among different groups of workers.
- The resilience of the pensions auto enrolment system, combined with increasingly positive attitudes towards saving for the short term, suggest that people might also value being automatically enrolled into liquid, emergency savings vehicles. This is an avenue we are exploring within our sidecar savings trial.
This research was funded by the Economic and Social Research Council (ESRC) as part of UK Research and Innovation’s (UKRI) rapid response to Covid-19 (grant number ES/V004867/1)
1) How has workers’ pay changed during the Covid-19 pandemic?
Jesal D. Sheth, University of Nottingham
It is now clear that the economic crisis fuelled by the pandemic has had drastic distributional effects. While many existing analyses2 have focused on aggregate changes in earnings or incomes across the UK, it is yet to be determined what the distributional impacts of the pandemic have been on pay growth across individuals.
In this piece, we investigate the distributional impacts of the pandemic on year-on-year growth in pensionable pay using data on members of the Nest pension scheme. The Nest dataset consists of pension records of over 9.9 million members across approximately 870,000 employers in the UK (as at May 2021). The Nest data offer granular, real-time information that relate to an individual’s lived experience – pertaining to pensionable pay and pension contributions, which in turn have implications for future financial resilience of these members. The Nest membership has relatively high coverage of sectors of the economy that have been affected most by the lockdown policies, such as retail and hospitality.3 Pensionable pay measures the component of income received by the employee which is pensionable.4 Pensionable pay includes payments made by employers under the government’s Coronavirus Job Retention Scheme (CJRS), also known as the furlough scheme.
Using data from 5% of Nest employers, we construct a measure of nominal pensionable pay growth by looking at the change in individual’s average pensionable pay per week relative to the previous year.
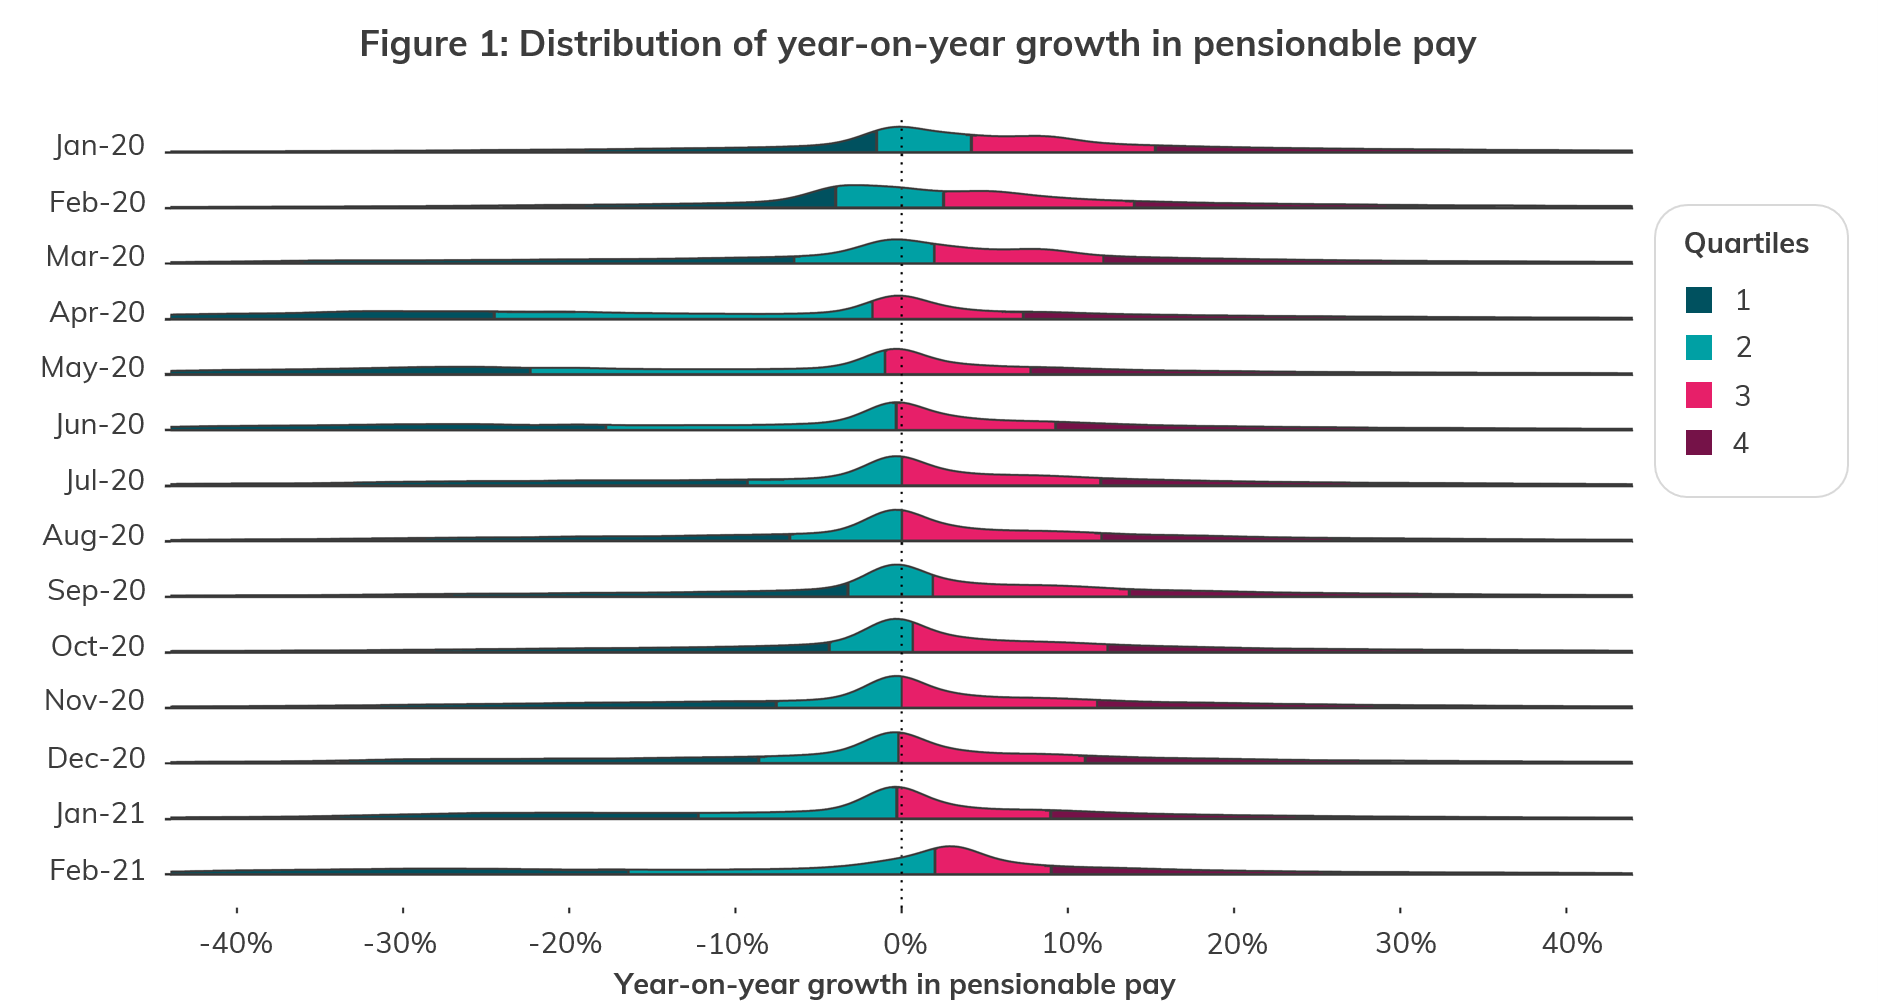
We find that the distribution of annual growth in pensionable pay has moved substantially over the course of the pandemic, as seen in Figure 1. In this graph, the bell curves show the distribution of percentage annual increases and decreases in average weekly pay during each month. For ease of reading, we’ve colour coded each quartile. This means that one quarter of the individuals in our study experienced percentage increases or decreases within the range covered by each coloured area.
As the distributions show, the median pensionable pay growth was positive during the pre-lockdown period from January to March 2020. However, from April to January 2021, the median pensionable pay growth dropped to zero. This means that half of the sample either saw a pensionable pay drop or no change in pensionable pay relative to the previous year during those months.
The second finding is that there is a substantial increase in the dispersion in pensionable pay reductions. In other words, of those that saw a decrease in pensionable pay relative to the previous year, an increased number saw large reductions in pensionable pay. This is particularly true for the months of April-June 2020 reflecting the impact of the first national lockdown. The distribution of pensionable pay growth then narrowed between July and October 2020. Interestingly, at the time of the second and third national lockdown in November 2020 and from January to February 2021, the incidence of pensionable pay reductions increased again which led to a renewed leftward shift in the distribution. This can be seen in the movement of quartile 1 pensionable pay growth over the course of the year. While pensionable pay growth seems generally volatile in February 2020, the direction of change in February 2021 is consistent with some renewed optimism in the labour market.
Changes in the distribution of annual growth in pensionable pay are consistent with changes in the CJRS statistics published by HMRC which show that employments furloughed reached close to 9 million in May 2020, fell back to 2 million in October 2020, but ticked up again to 4 million in November 2020, and reached 5 million in January 2021. In contrast, for those individuals that saw a pensionable pay increase, the distribution of pensionable pay growth remained relatively unchanged. These important nuances are masked by aggregate analyses of average or median pay growth.
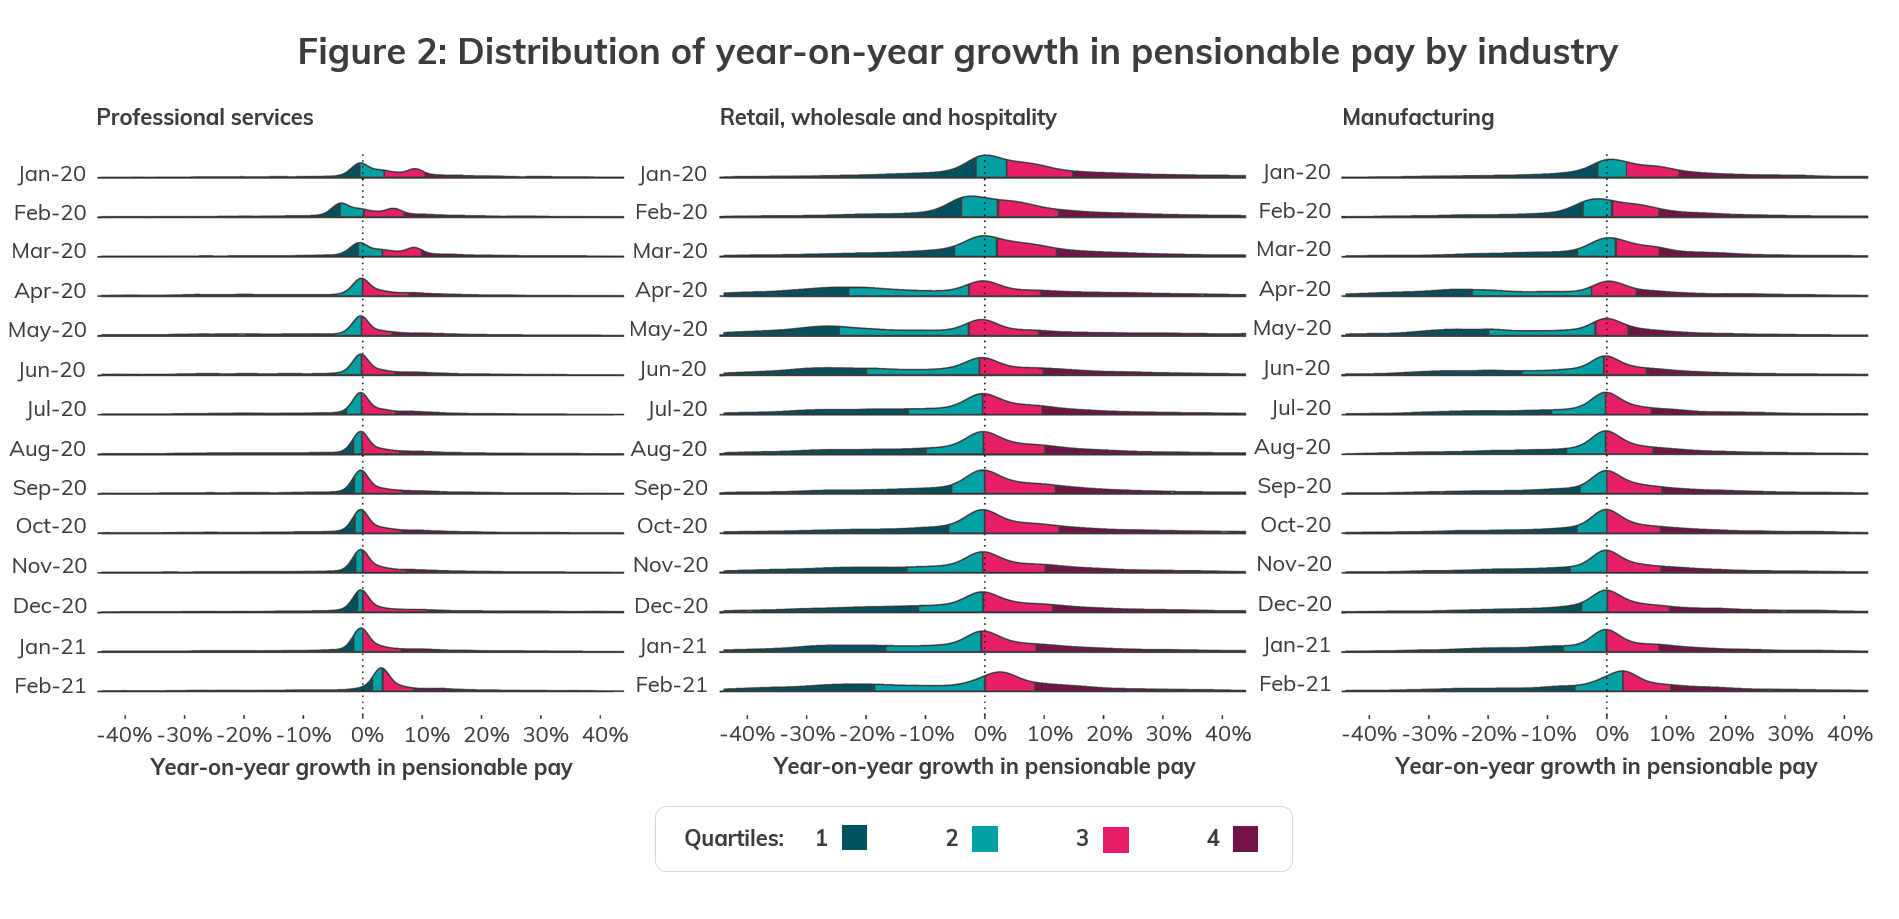
A next question is what areas of the labour market are responsible for this pattern. We investigate movements in the distribution of pensionable pay growth across sectors as seen in Figure 2. We construct broad categories of sectors by combining the following sectors:
- ‘Professional services’ includes information and communication; professional, scientific, and technical; real estate; and administration and support services.
- ‘Retail, wholesale, and hospitality’ includes wholesale; arts, sports, and recreation; retail, hire and repair; and catering and accommodation.
- ‘Manufacturing’ includes manufacturing; and mining, energy, and utilities.
We find that for professional services, the distribution of pensionable pay growth has narrowed around zero during the pandemic. In contrast, retail, wholesale and hospitality, and manufacturing are responsible for the leftward shift in the distribution that is observed in the aggregate. In particular, the left tail in the pensionable pay growth distribution is fatter in retail, wholesale, and hospitality across the lockdown months consistent with more stringent restrictions faced by those sectors. While the distribution of pensionable pay growth in manufacturing “normalises” in Q3 and Q4 of 2020, and early 2021, retail, wholesale and hospitality have been subjected to a substantial dispersion in pensionable pay reductions again between November 2020 and early 2021. This suggests that the second and the third national lockdowns had a differential impact on the labour market compared to the first national lockdown.
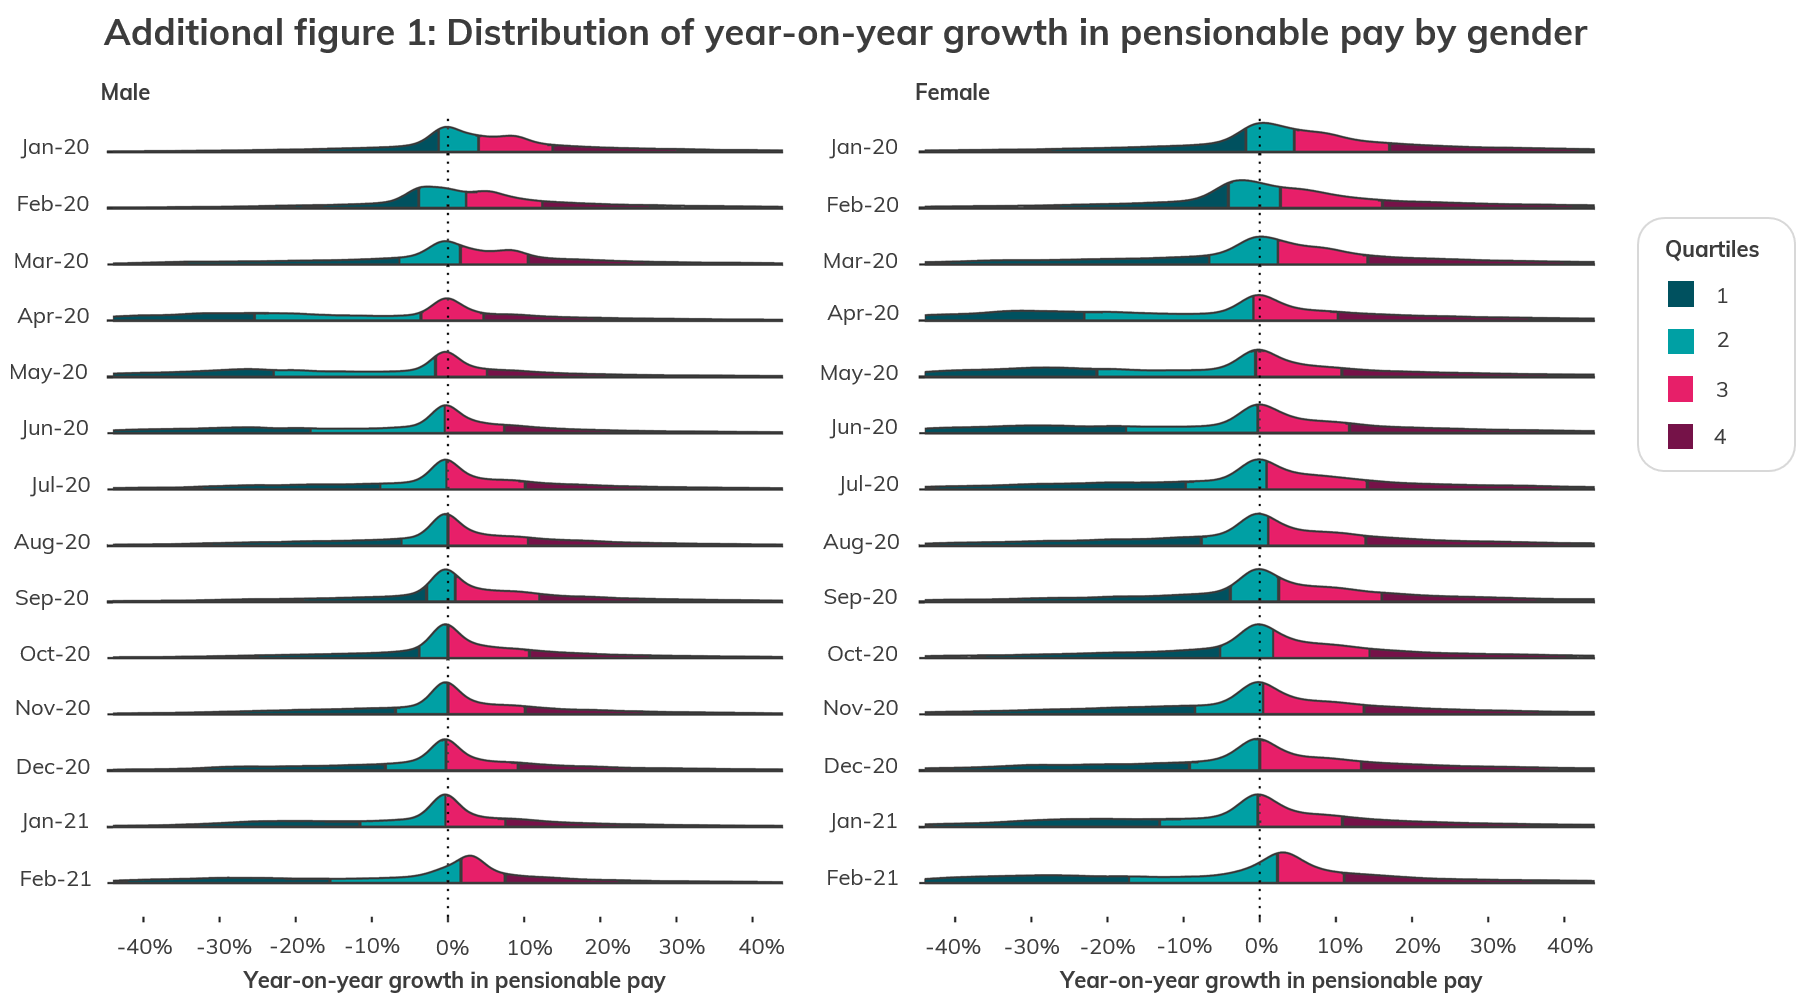
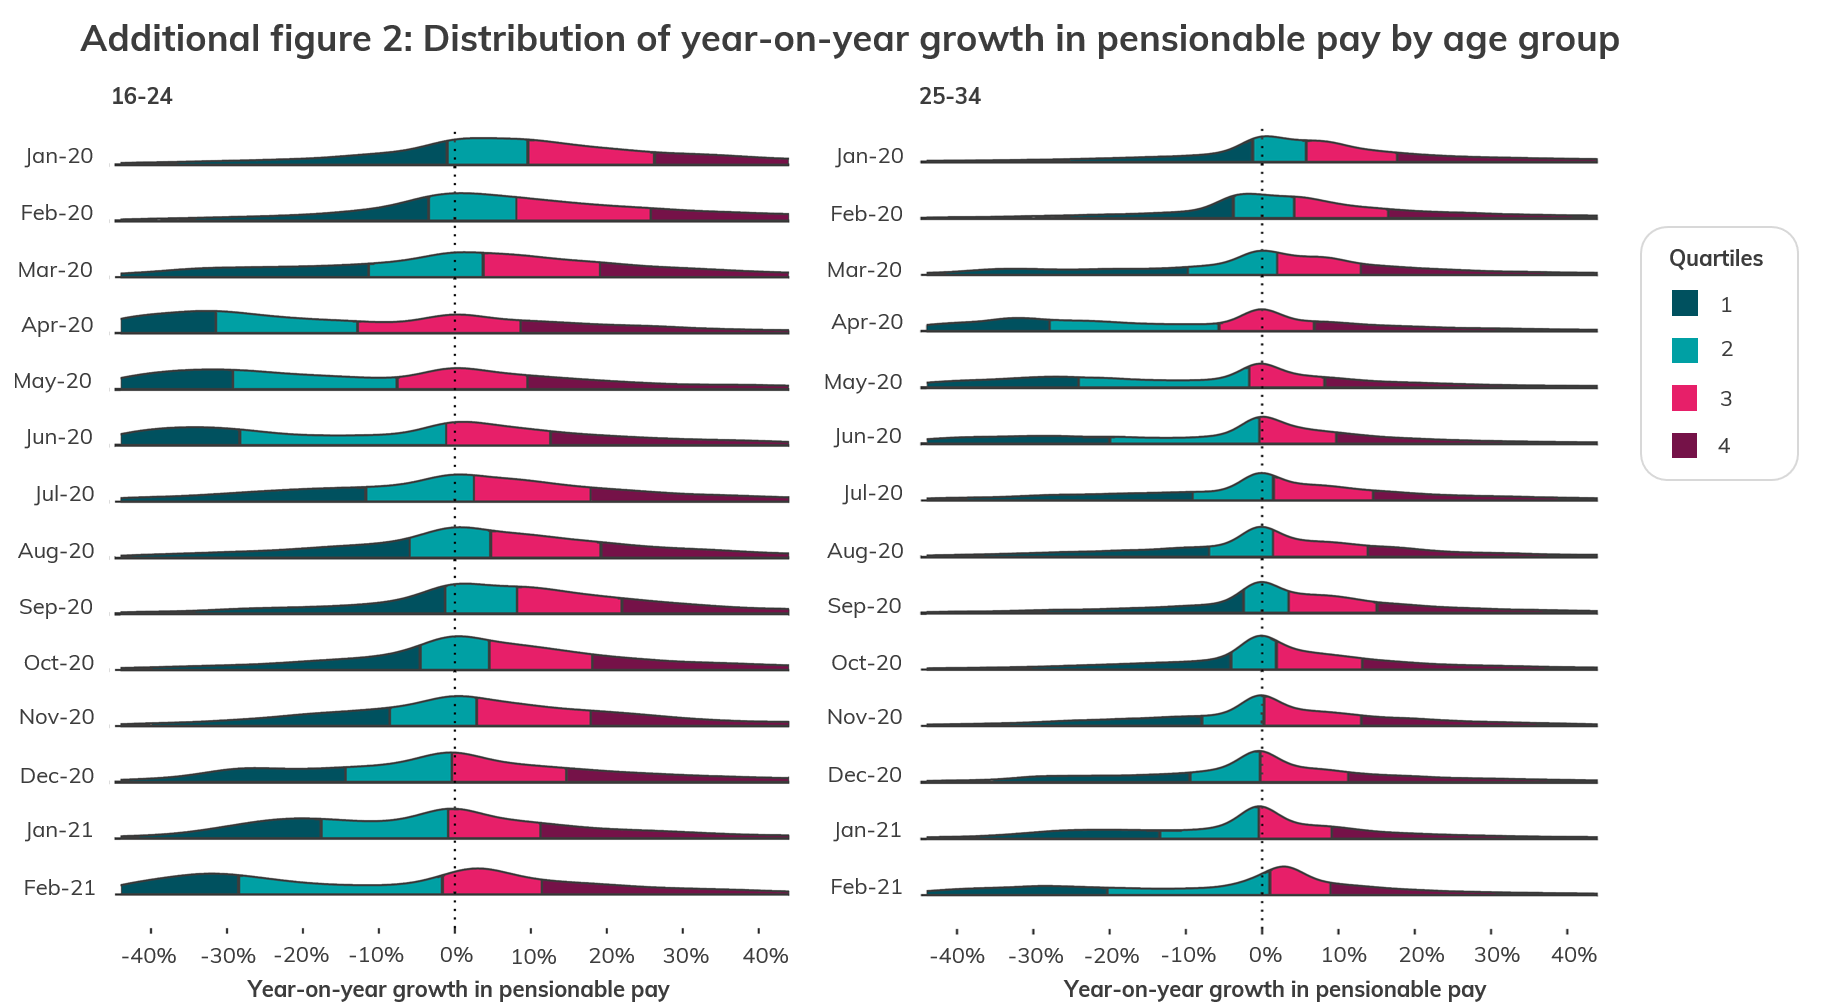
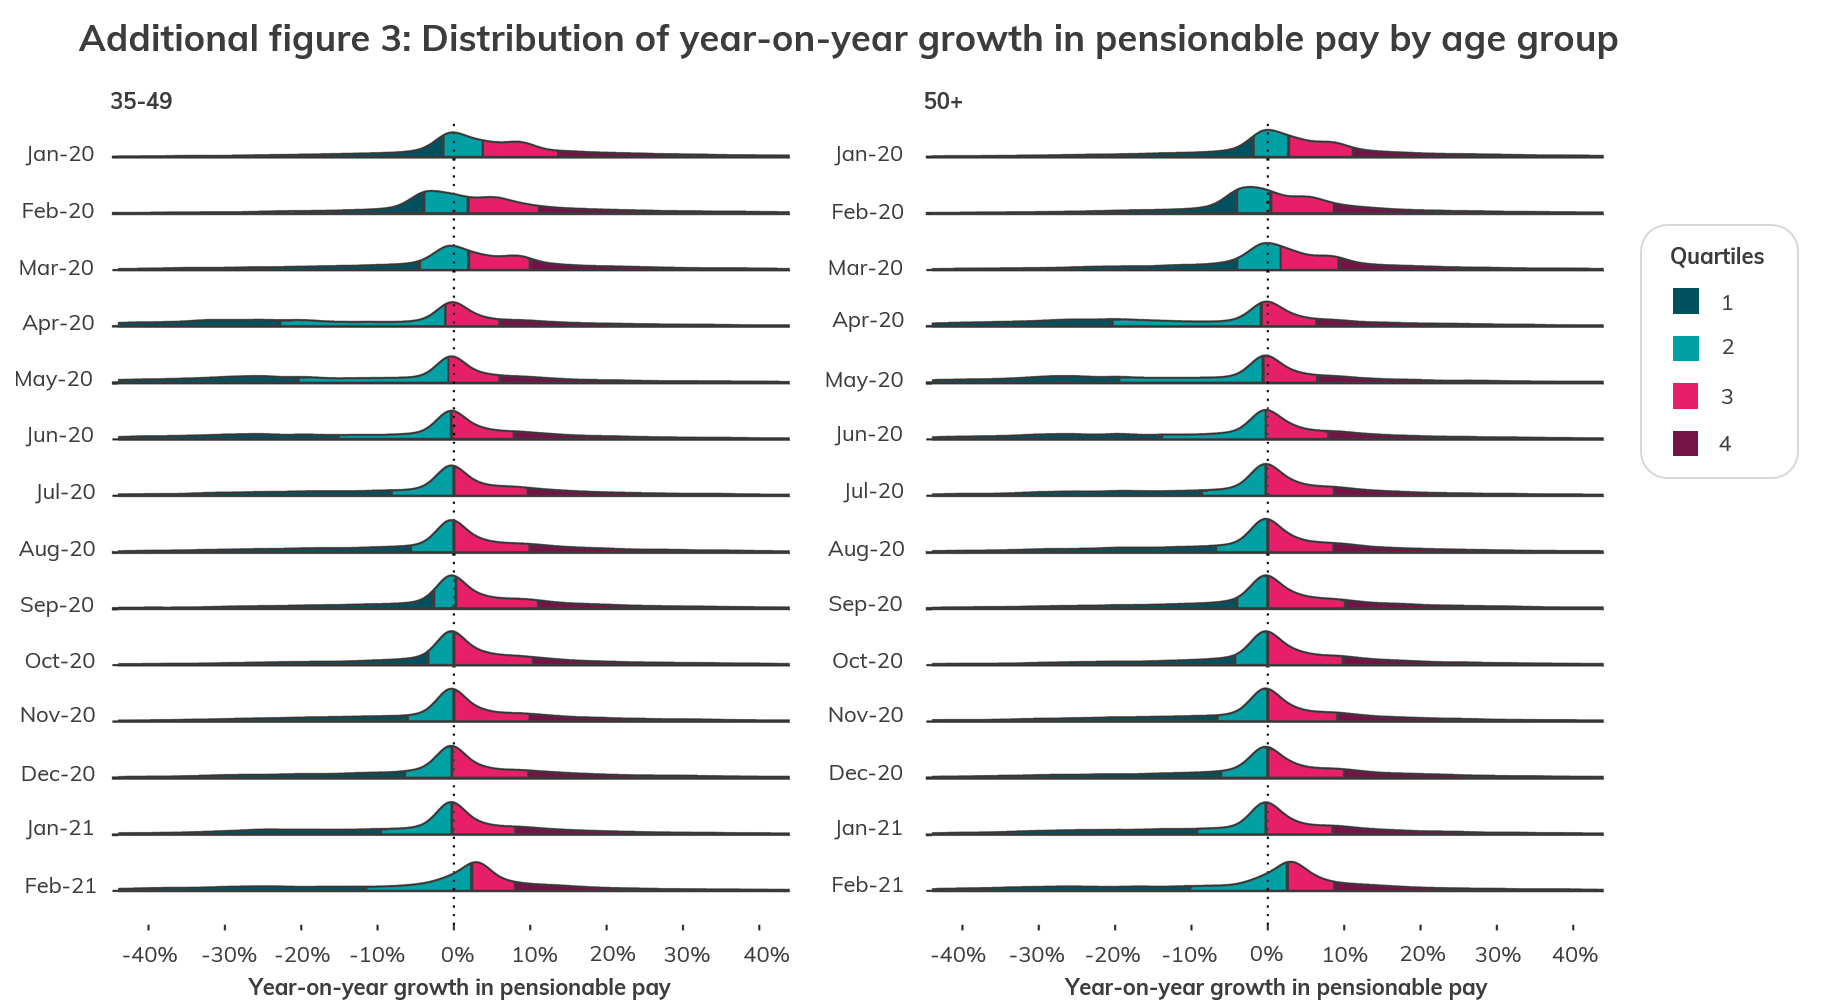
 Consistent with the sectoral level findings, we see some widening in the dispersion of pensionable pay reductions for women relative to men as well as for young people (figures provided in the Annex). This is consistent in the sample with the female worker share in retail, wholesale, and hospitality being higher than in other sectors (50% in retail, wholesale, and hospitality, relative to 20% in manufacturing and 42% in professional services) and the share of young people in retail, wholesale, and hospitality is higher than in other sectors (as reflected in the average age of 40 in retail, wholesale, and hospitality relative to 43 in manufacturing and professional services).5 The additional impact of gender over and above sector appears to be small.
Our findings show the effects of the pandemic on growth in pensionable pay. Amongst the group that lost out in terms of pensionable pay growth, there is a significant proportion that lost out more than others. The industry analysis, in particular, raises the challenge that blanket policies will naturally have differential impacts on different parts of the labour market. This raises the question of whether more targeted interventions will also be needed. We will continue to monitor these effects as the lockdown eases. It will be particularly important to see how pensionable pay growth might change for different groups as the economy reopens and the government’s support measures come to an end.
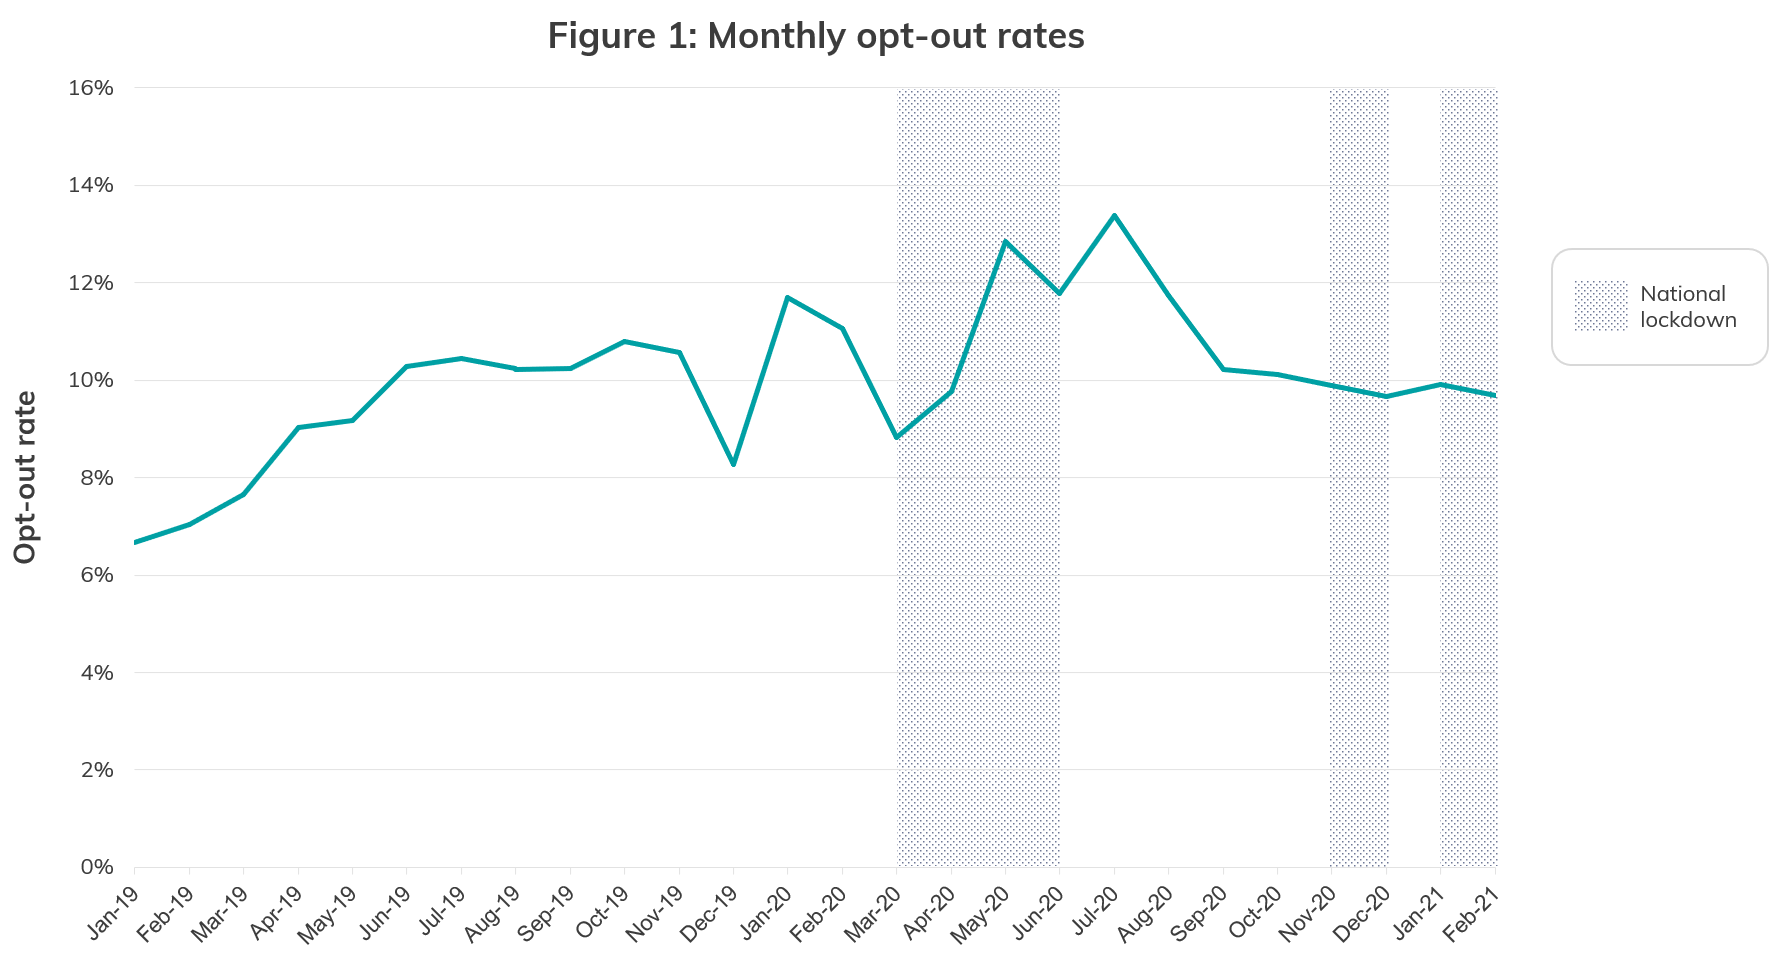
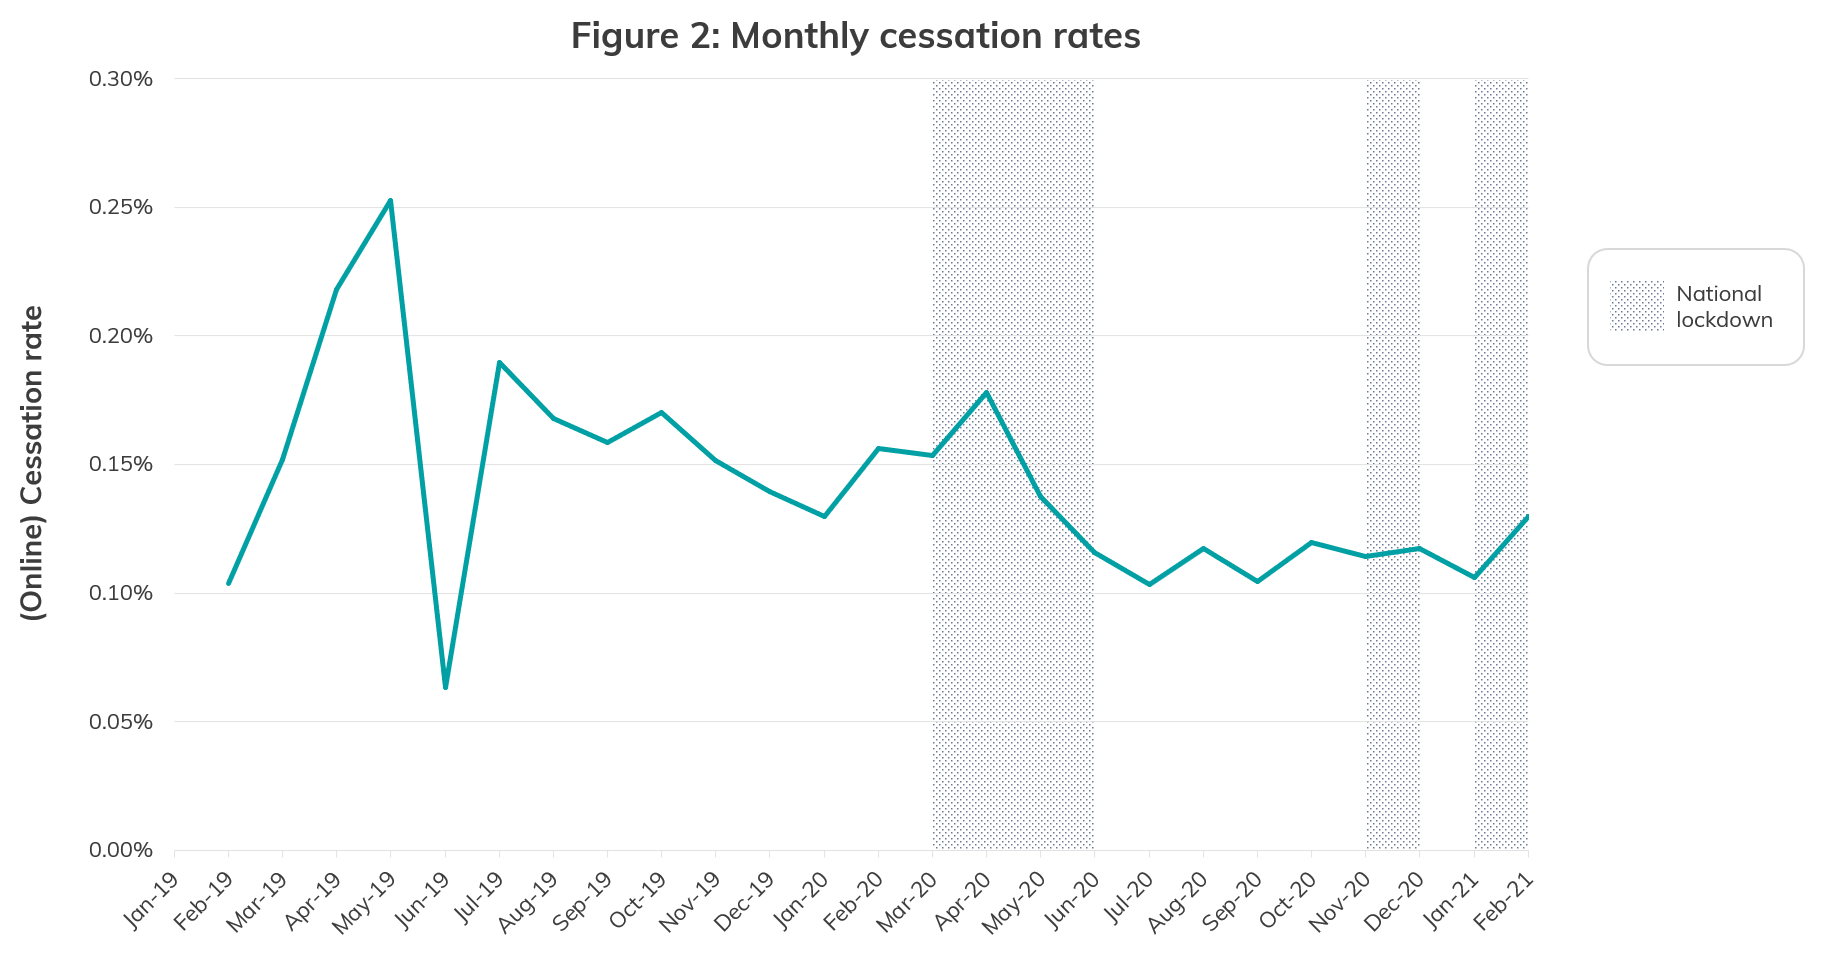
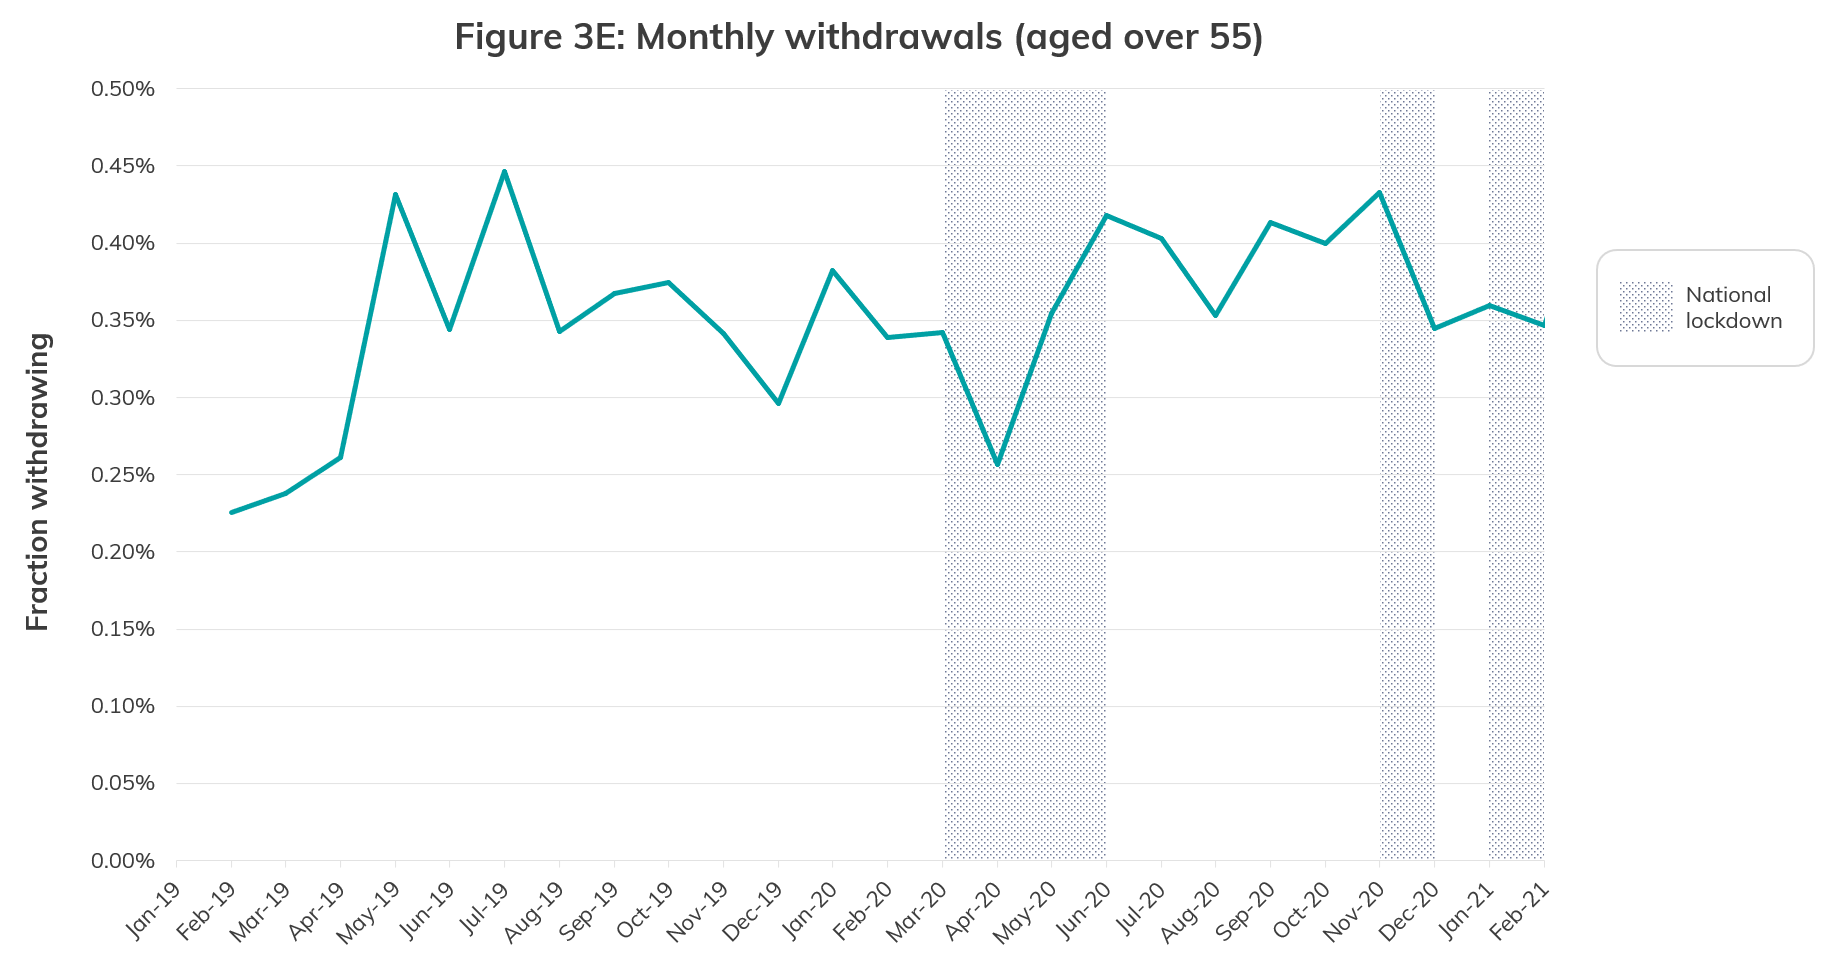
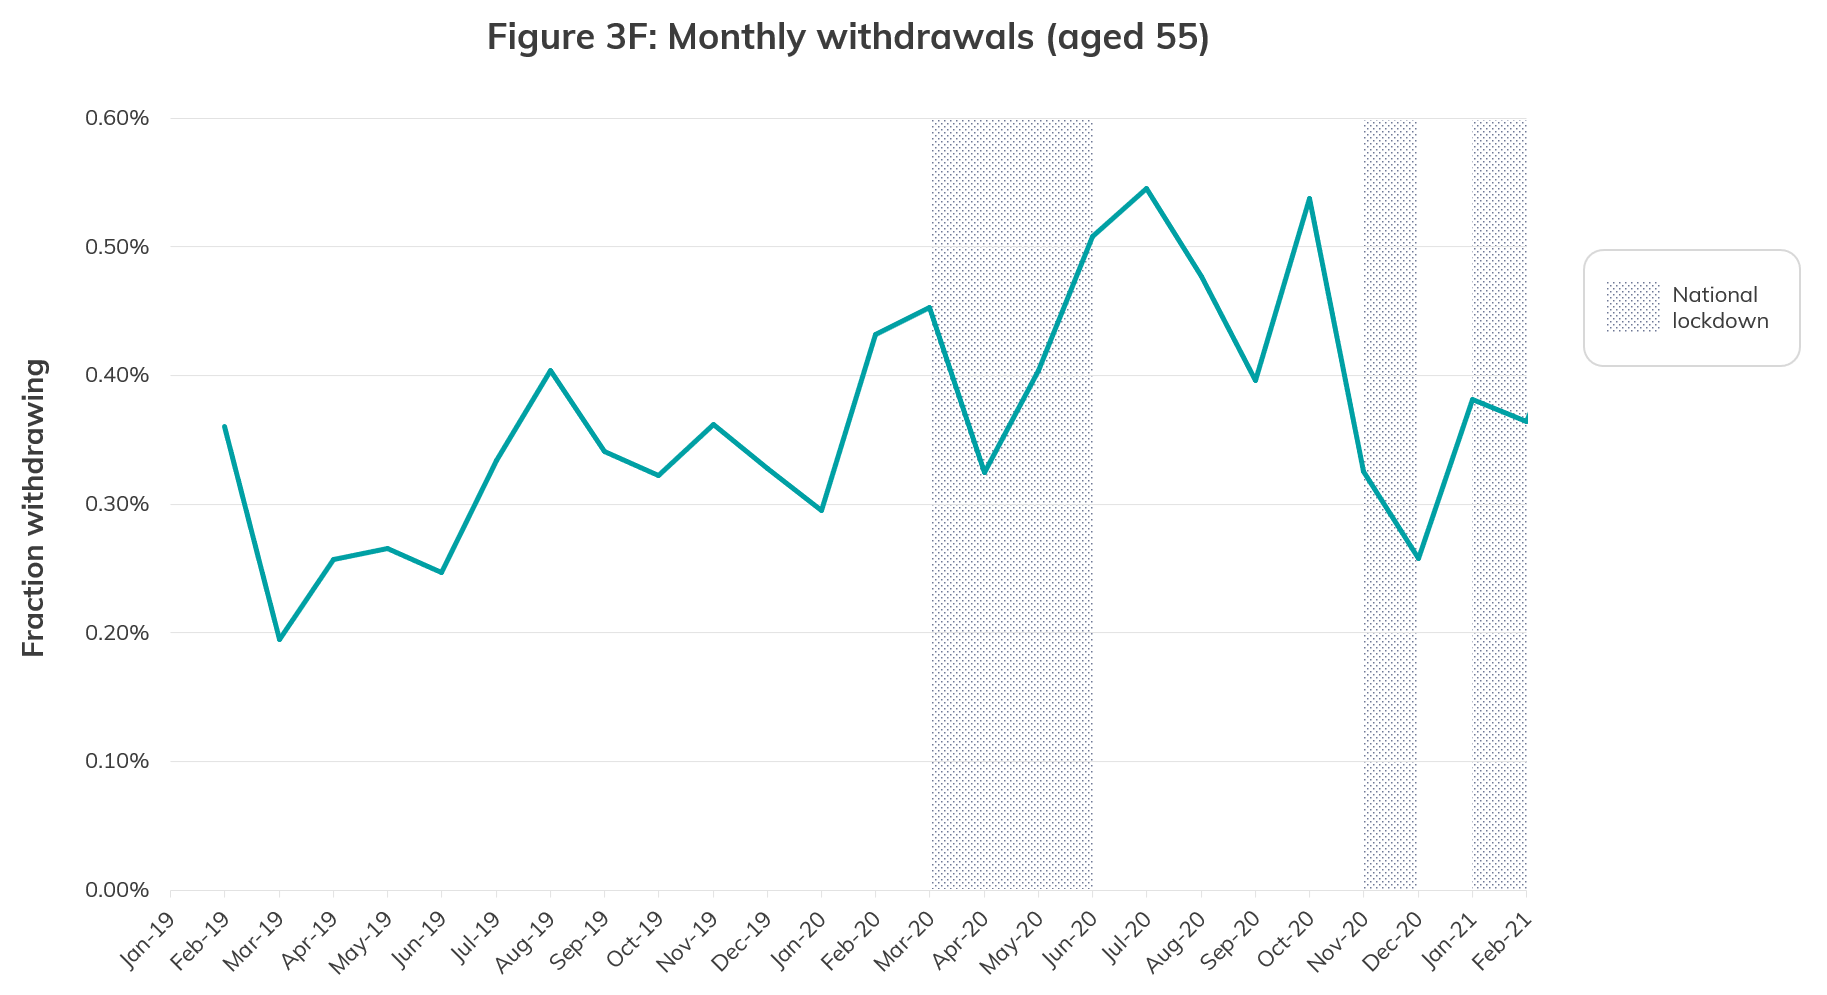
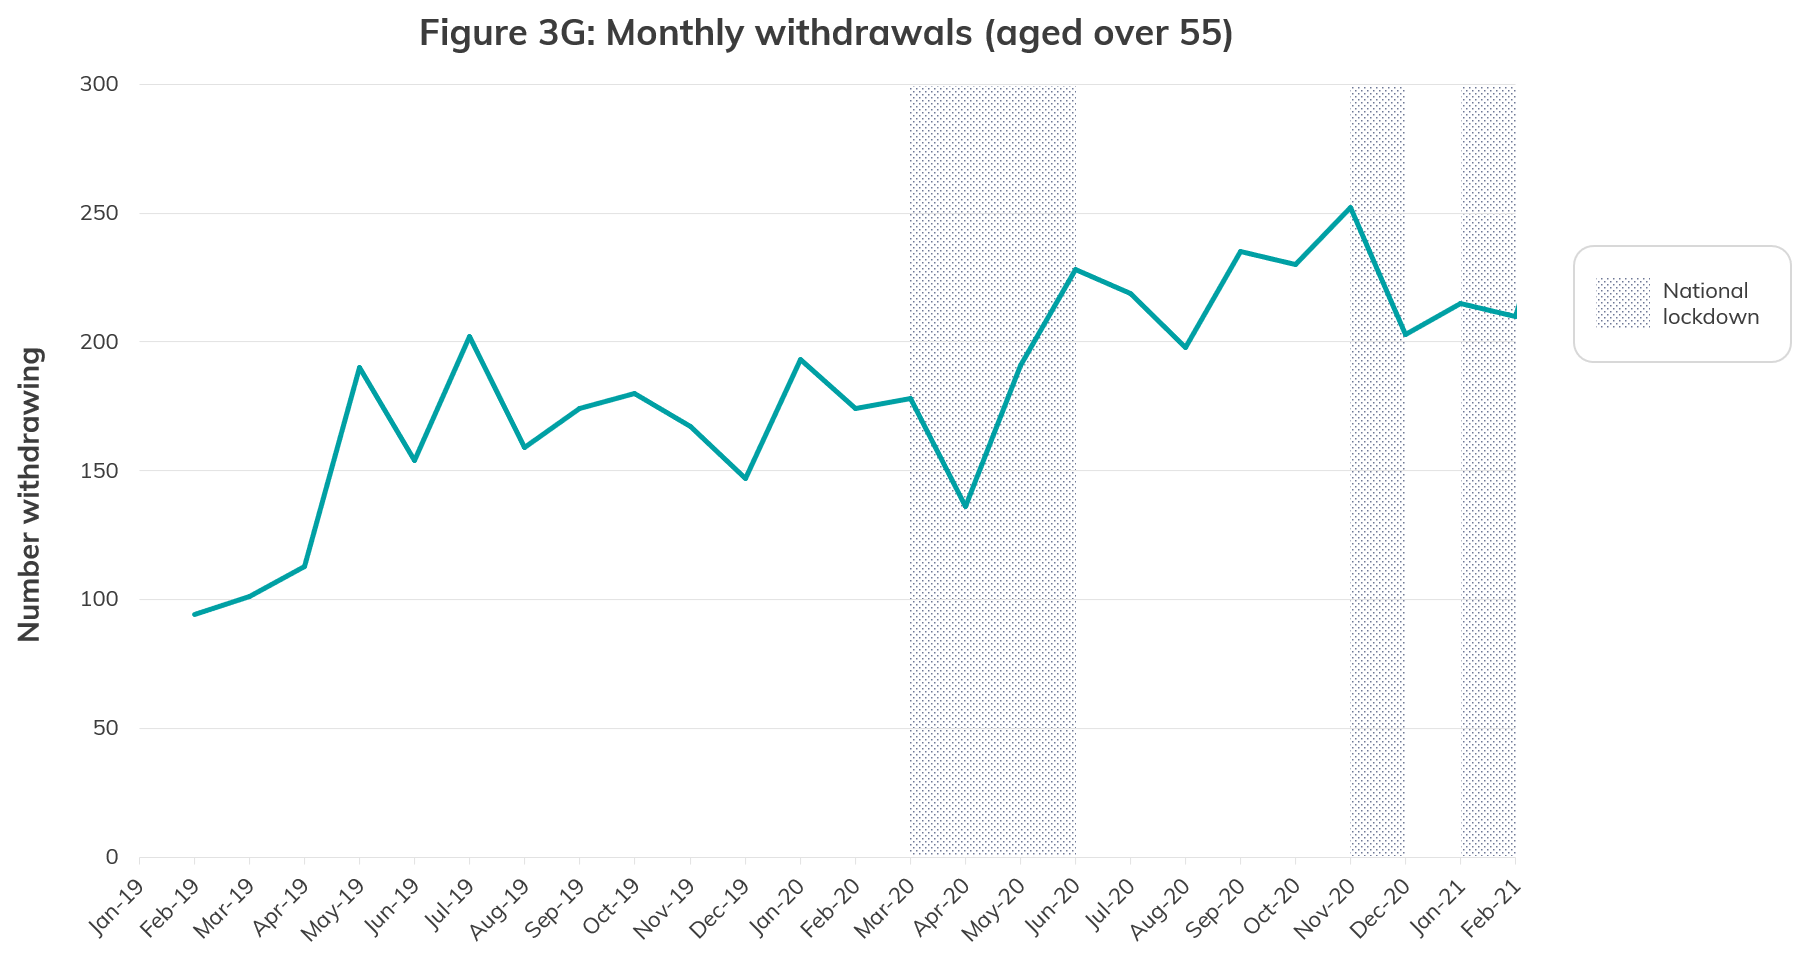
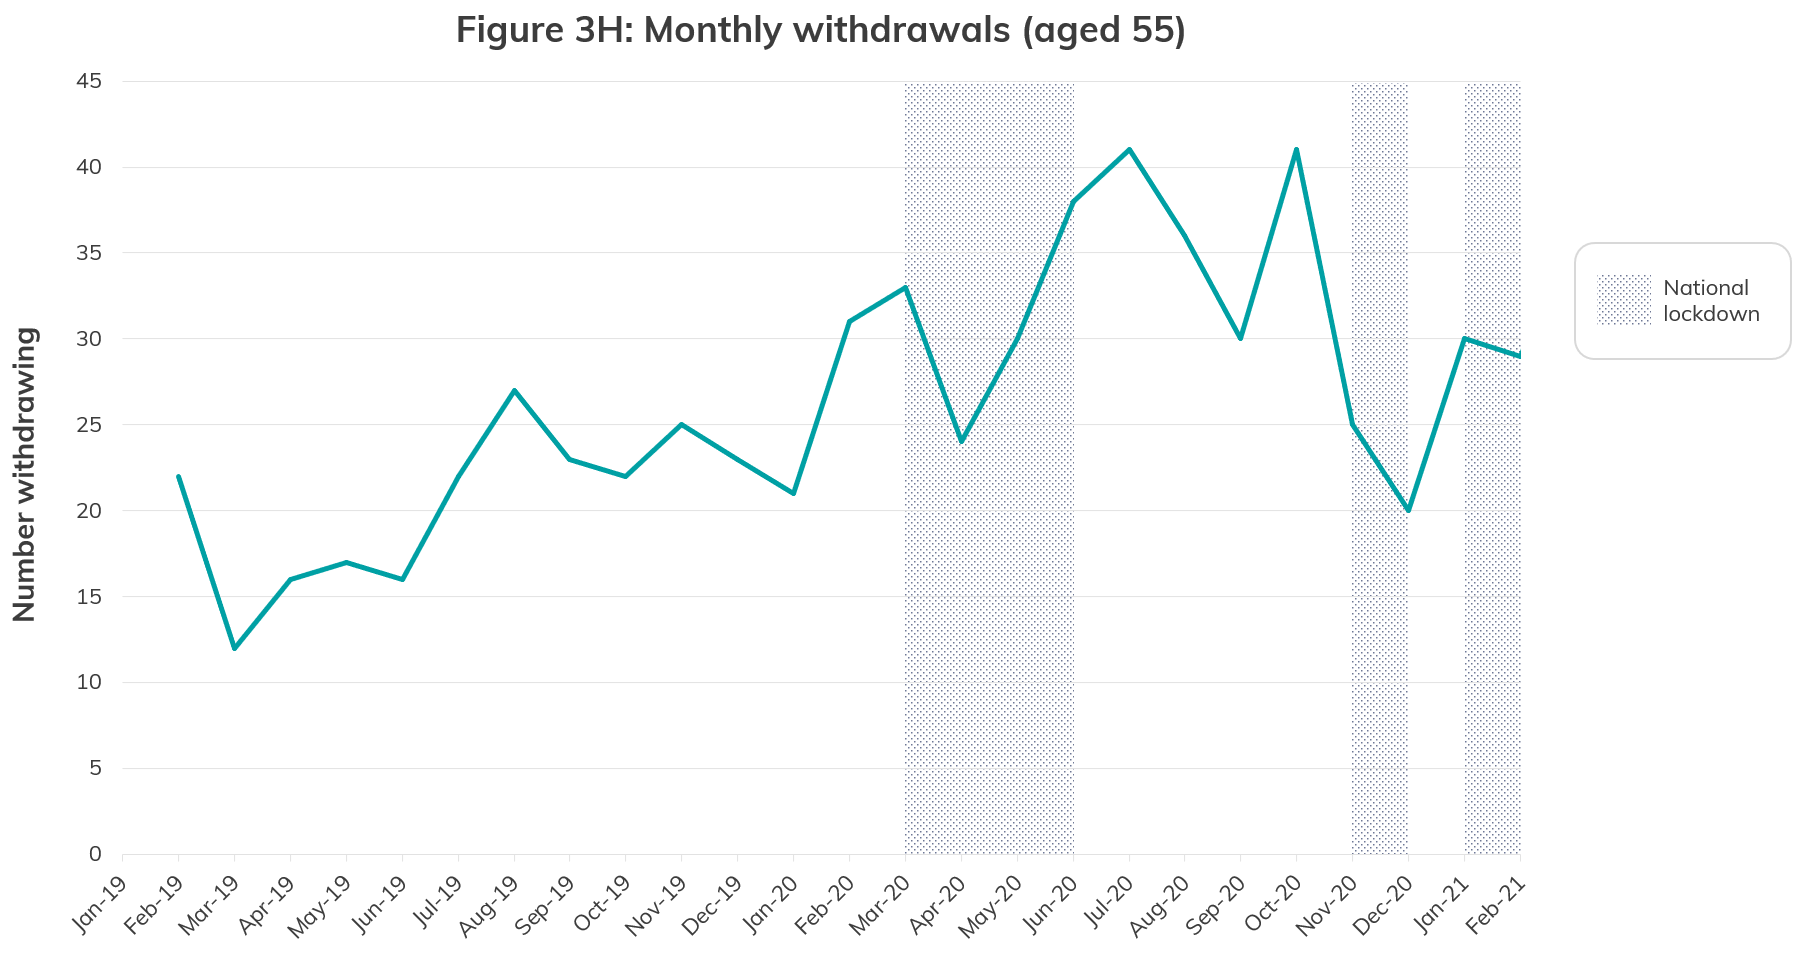
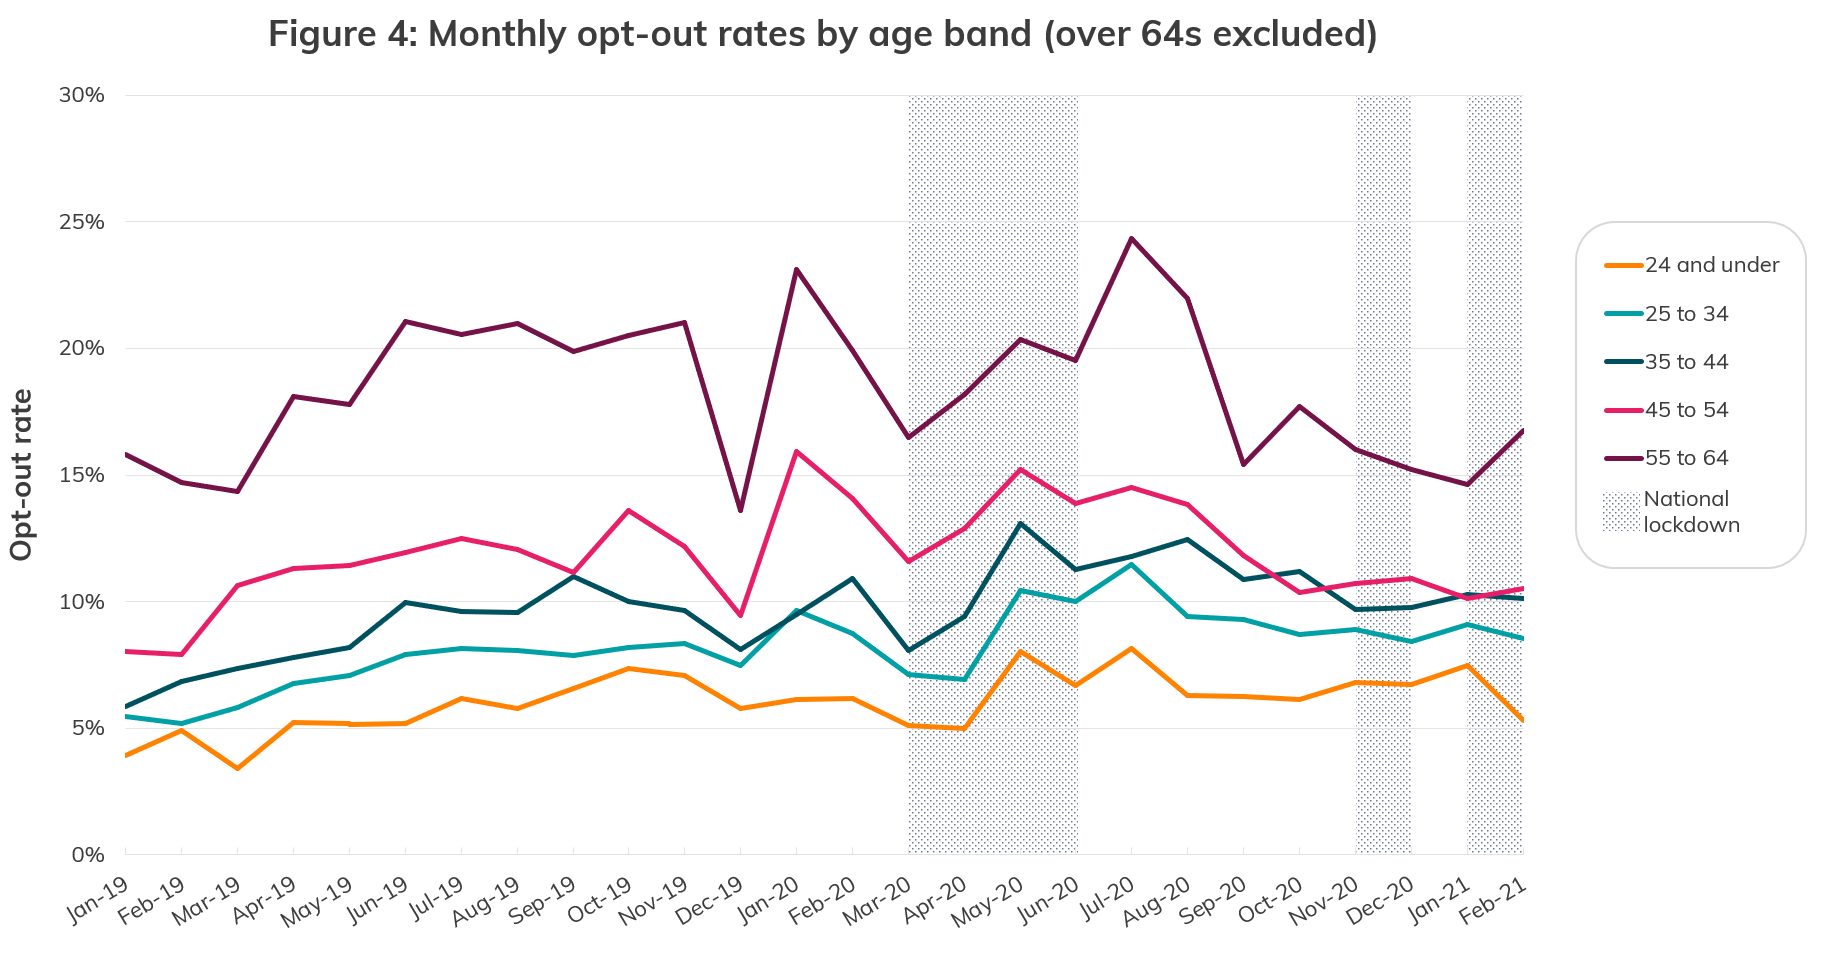
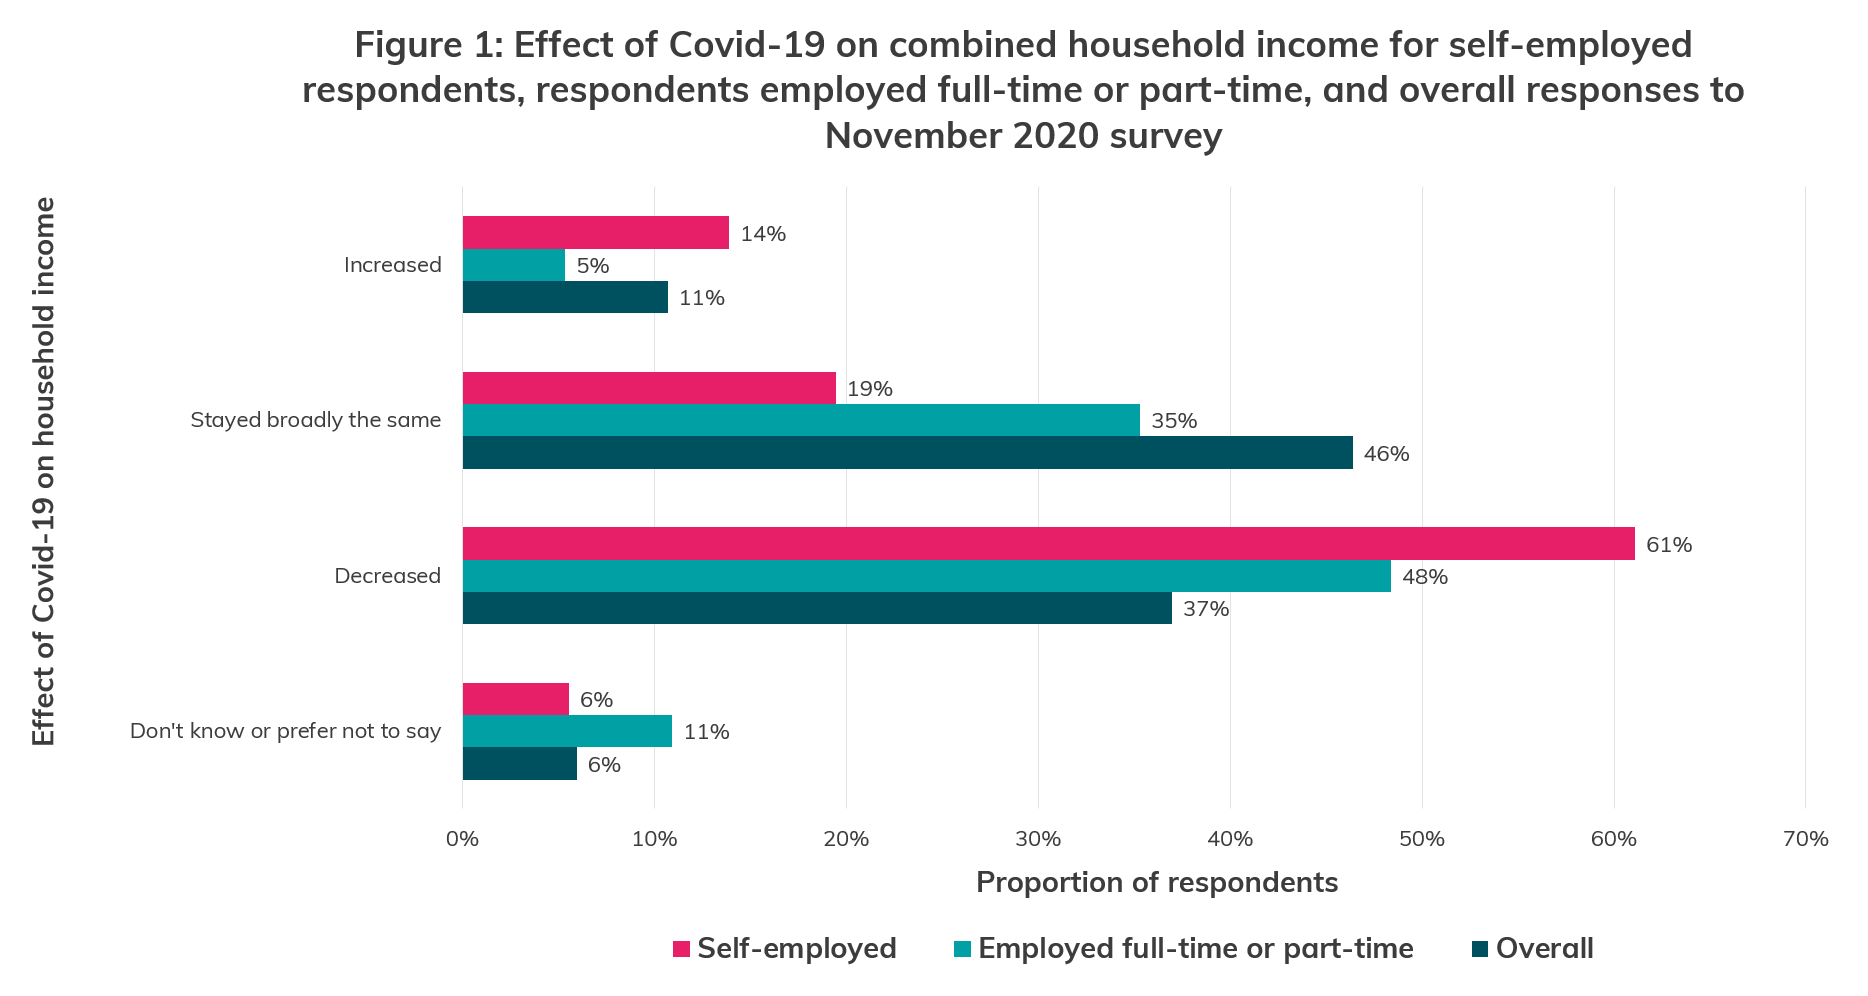
For references, technical notes and additional figures: This research was funded by the Economic and Social Research Council (ESRC) as part of UK Research and Innovation’s (UKRI) rapid response to Covid-19 (grant number ES/V004867/1) Chris Firth, Warwick Business School The Covid-19 pandemic has raised concerns that households facing financial stress or fears of future hardship might choose to tap their long-term savings or suspend pension contributions, as ways of maintaining a higher disposable income6 or bolstering emergency cash. Around a third of those eligible for pension auto enrolment have less than £1,500 in liquid savings.7 The proportion of people with low financial resilience increased by 3.5 million to 14.2 million (27% of UK adults) between March and October 20208 and so, at first blush, we might expect to see dramatic activity at workplace pension schemes from nervous pension holders. However, previous studies drawing on international experience show there is a strong countervailing force of inertia. For example, Madrian and Shea (2001) note a tendency towards default contribution rates and fund allocations under auto enrolment. Similarly, Agnew, Balduzzi, and Sunden (2003) who studied retirement accounts, report there is very limited portfolio reshuffling. In their sample, almost 90 percent of people made no trades across a year. More broadly, Andersen, Campbell, Nielsen, and Ramadorai (2020) note a robust finding of inaction in household financial decision-making, even when capital market conditions are changing. Further, Bilias, Georgarakos, and Haliassos (2010) found that in brokerage accounts the bulk of users exhibit considerable inertia in trading and in entry and exit. The same conclusion was also drawn by Calvet, Campbell, and Sodini (2009). This past research characterises pension schemes as calm places where participants are somewhat disengaged from the process of retirement savings accumulation. Yet, the Covid-19 crisis is unprecedented and the normal rules of behaviour may not apply. In this post, we aim to understand better what the net behavioural effect – inertia versus stimulated action – has been on members of Nest. We examine factors that affect opt-out, cessation and withdrawal rates – and in particular, changes seen since the first lockdown. We first explore trends in opt-out, cessation and withdrawal rates prior to and during the pandemic. The Nest dataset as of May 2021 contains pension records of over 9.9 million employee members, working at around 870,000 employers in the UK. Under auto enrolment, individuals have flexibility over whether they save, and some choice over how much they save9, but limited flexibility to withdraw their savings. Members can opt out of auto enrolment within one month of being enrolled. Thus opt-out is only a feature for individuals as they enter a new job. Once enrolled and contributing they can cease contributions at any time, and are able to do this via their employers or directly via the Nest website.10 Cessation is when a member who has already started building their pension pot ceases contributions. In such cases, individuals have previously accepted their enrolment into a contributory scheme, but then at a later point chosen to interrupt their saving. Members cannot access the money in their pension pot until they reach age 55 except in very rare cases, when seriously ill. From their 55th birthday, it becomes fully accessible. For this reason, we look at withdrawals for anyone aged 55 and above. By the end of 2019, opt-out rates had stabilised at approximately 10% (Figure 1) meaning that 90% of new enrolees either “actively” accepted their auto enrolment or “passively” made no decision. In 2020 the situation did not change dramatically, but there was a rise of opt-outs to 12-13% during the months of the first lockdown and a further spike in the summer (also Figure 1). However, by September 2020 it appears that normality had been restored. The rates for the first quarter of 2021 are no different from those in the second half of 2019. The opt-out rate is in part a function of the types of individuals being enrolled at a given time, and the types of jobs they are working in. For example, the opt-out rate varies between age groups, and between those joining a new employment, versus those who are being re-enrolled for a second or third time by their existing employer.11 Because labour market conditions changed markedly over the spring and summer of 2020, due to lockdown measures, opt-outs during the pandemic may not be wholly comparable to those before the crisis began. Despite this, there is preliminary evidence that a small segment of employees shows a precautionary reaction to fears of job loss, reduced income or other adverse risks. What is the equivalent picture for cessation rates? Given a prior commitment to long-term saving, it might be reasonable to think that cessation rates would be less sensitive to a crisis and potential behavioural responses such as avoiding new costs would be more likely than reducing the existing cost of pension contributions. Figure 2 supports this assumption. It shows no clear evidence of an increase in cessation rates. If anything, cessation rates have decreased during the pandemic. Withdrawals also seem to follow a trend of “business as usual” (see Figure 3) although spikes in the numbers of members withdrawing are seen towards the end of the data period under study. Monthly variation was also seen in 2019, and so any 2020-21 spikes could be unrelated to the crisis. However, we cannot rule out that a small number of members did withdraw earlier than they would have otherwise have done, perhaps because of needs triggered by pandemic-related concerns. The underlying drivers of opt-outs are varied and likely interact in a complex fashion. These factors include the volumes and mix of new jobs entering the auto enrolment system; whether the worker being enrolled is a new joiner or an existing employee; the age of employees; industry-related stability and pandemic impacts; employer size; employee (or household) income profile; overall financial situation of members such as wealth; member health; and relevant levels of government support.12 For example, Disney, Ratcliffe, and Smith (2015) find increases in unemployment are associated with earlier retirement, while increases in wages delay retirement; we might expect local job market conditions to affect opt-out choices too. Attanasio and Rohwedder (2003), for instance, note that for those building pension pots there is a trade-off between pension value and other financial wealth, but that this does not hold for the youngest individuals, who could be affected more by liquidity constraints. Clearly, different industries have been hit harder than others in the crisis.13 Both employers and employees in the worst affected industries will feel more at risk. Our initial analysis is not able to consider all of those factors.14 Nevertheless, we already see some clear patterns. Figure 4 shows that age is an important driver of opt-out rates, opt-outs increasing with age. This relationship holds pre- and post-crisis. The increases seen in Figure 1 broadly repeat across all age bands. However, the effects are not uniform. The 35 to 44 and 45 to 54 age bands each account for around 40% of the increase in opt-out rates. By contract, the 55 to 64 and 25 to 34 bands account for around 9%. When we drill down by industry, we observe large structural differences. For example, Agriculture, forestry and fishing opt-out rates average over 25% across 2019-20 versus an overall rate of 9-10% in these two years. This same industry increased its contribution of total opt-outs (mean increase over April to November 2020 and using December 2019 rates as a base) by 130%. The figures for Construction and Transportation and storage are broadly similar. Finally, looking at the differential opt-out rates by employer size we observe large structural differences by firm size. Firms of size 1 to 4 employees have double the opt-out rates of firms with 250-499 employees. Most of the increase in opt-outs has come from firms with up to 249 employees whereas employees of larger firms have barely changed their behaviour at all. Overall, we do not observe dramatic changes in voluntary retirement savings behaviours during the pandemic relative to the pre-pandemic period. While we see increases in opt-out rates, especially in sectors such as agriculture, forestry and fishing, the calmness seen in pension schemes during the pandemic raises the question of whether it is accompanied by stronger effects in other aspects of individuals’ financial lives, such as borrowing behaviours and debt levels. Readers may be left with the impression that inactivity in pension schemes reflects ignorance or apathy. This may only be part of the story; inertia can be a rational approach. Bacchetta and van Wincoop (2010), for instance, show that gains from making frequent portfolio decisions are offset by corresponding fees. Moreover, a good equity strategy during the pandemic would have been to sit tight and do nothing. World stock market indices are showing healthy gains over the last year. We must also emphasise that our initial findings are far from conclusive, both from a methodological perspective and from a timeline consideration. We will further investigate voluntary retirement savings behaviours, particularly as state support measures wind down and new data become available. For technical notes and references: This research was funded by the Economic and Social Research Council (ESRC) as part of UK Research and Innovation’s (UKRI) rapid response to Covid-19 (grant number ES/V004867/1) Marwan Hassan, Nest Insight, and Jesal D. Sheth, University of Nottingham The Covid-19 pandemic has impacted the financial wellbeing of everyone in the country – for better or for worse. The first blog post in this series highlighted some groups who have suffered at the hands of the pandemic, most obviously those in affected sectors such as retail, wholesale, and hospitality. In contrast, those with high incomes who have been able to work from home comfortably have been part of a six million strong group of “accidental savers” (Lane Clark & Peacock, 2021). Nest Insight has been surveying Nest members’ financial wellbeing for some time now, as part of our work on emergency savings. By comparing the results of two of these surveys we explore here how the pandemic has impacted the financial wellbeing of a sample of Nest members. The surveys were sent to members of the same sample of Nest members in November 2019 and November 2020, receiving 7,183 responses and 1,634 responses respectively. Our first finding, from the November 2020 survey, is that the self-employed, the unemployed and those unable to work due to sickness were statistically significantly more likely to report that the pandemic has had a negative impact on their household incomes, relative to those who were employed full-time or part-time. Lower income groups were also significantly more likely to report a reduction in household income relative to the middle-income groups, whereas higher income groups reported increased household income relative to the middle-income groups.15 Consistent with our findings here and in our previous work on the impact of Covid-19 on the self-employed (Nest Insight, 2020), the Financial Conduct Authority (2021) has also highlighted income challenges faced by self-employed workers due to the pandemic – they note that 60% of self-employed adults experienced an income reduction between March and October 2020 (Figure 1 below paints a similar picture using the November 2020 responses, where 61% of self-employed respondents declared a negative effect of the pandemic on their combined household income).16 Research by the Trade Unions Congress (TUC) also suggests that those on lower incomes at the beginning of the pandemic have suffered more financially. Not only were those on lower incomes more likely to have been furloughed or lost their jobs, but furloughed low-paid workers were most likely not to have their pay topped up, leading to 1.3 million people being paid below minimum wage in April 2020 as a result of being furloughed with reduced pay (TUC, 2021). The pandemic had not yet affected the UK in November 2019, meaning questions on the direct effect of it on financial wellbeing were only introduced in our second survey. However, many questions on financial wellbeing are common across the two surveys.17 While it is possible to learn something about the effects of the pandemic on financial wellbeing by comparing responses across both surveys, it’s important to note that the surveys were not conducted with the intention to track or compare responses across the two waves. Therefore, the findings reported below only provide suggestive, although supporting, evidence for the findings mentioned above and must be interpreted with caution.18 When we compare responses across the two waves to questions on satisfaction with financial situation, we find that self-employed people reported significantly lower levels of satisfaction with their financial situation in November 2020 relative to the November 2019 survey, controlling for a number of variables.19 Self-employed members were also more anxious about their financial situation in November 2020 than in November 2019 which supports the findings mentioned earlier and may reflect the negative experiences of this group through the pandemic. The Institute for Fiscal Studies (2021) note that, despite huge spending on support packages including the Self-Employment Income Support Scheme (SEISS), important groups of self-employed workers were not eligible for such support. We also find that unemployed respondents were significantly much less confident in November 2020 relative to November 2019 in their ability to provide for themselves in retirement, which may be driven by their negative expectations about the future job market situation. Those who were unable to work due to sickness also felt significantly much less likely in being able to provide for themselves in retirement in responses to November 2020 survey relative to November 2019. We also asked respondents how important they thought it was to save money for an emergency. On average, perceptions about saving for an emergency increased in importance in the second wave of the survey relative to the first wave. Overall, the number of respondents that felt saving for an emergency was important rose from 85% to 88% between November 2019 and November 2020. While the wider body of research seems to support the general findings from our own surveys, more groups are proposed to have suffered financially due to the pandemic. These groups include young people, parents with dependent children, women, single parents, workers in ethnic minority groups, and private and social renters. Many factors may influence why those in the mentioned groups may be more susceptible to the negative financial impacts of the Covid-19 pandemic and these factors often overlap. For example, black African and black Caribbean men are both 50% more likely to work in shut-down sectors (the Money and Pensions Service, 2020). Analysis by the Resolution Foundation (2021) found that families with children estimated to be in the lowest pre-pandemic income quintile were twice as likely to report an increase in spending than a decrease, with the increase going towards food, energy, home schooling costs, and entertainment for homebound children. Single parents may have had to carry the heavy burden of such costs alone. The pandemic has been far-reaching and complex in its impact on personal finances. The sample size and demographic composition of our survey responses makes capturing the full effects of the pandemic difficult. Though we identify a number of general trends which are supported by some of the broader research to date, it is clear that there is more to be learnt about the nuances of the pandemic and the groups it has impacted as the dust continues to settle and as we slowly return to a new normality. For a full list of references: This research was funded by the Economic and Social Research Council (ESRC) as part of UK Research and Innovation’s (UKRI) rapid response to Covid-19 (grant number ES/V004867/1)
2) How have workplace pensions behaviours changed during the Covid-19 pandemic?
Trends at Nest
Exploring opt-outs
Conclusion
3) Covid-19 and financial wellbeing: insights from Nest surveys
Footnotes
1. How satisfied are you with your overall financial circumstances? (0 = Not satisfied at all, 10 = completely satisfied)
2. To what extent do you agree or disagree with the following statement? “Thinking about my financial situation makes me anxious.” (1 = Strongly agree, 5 = Strongly Disagree, 6 = Don’t know)
3. How confident are you that you will be able to financially provide for yourself in retirement, considering what you have put in place so far, and plan to in the future? (0 = Not at all confident, 10 = Very confident)
Thinking overall about finances, how important, if at all do you think it is to save money for an emergency? (1 = Very important, 5 = Very unimportant, 6 = Don’t know)
